MFG Empire | Marketing Built for Manufacturers, York, Pennsylvania
American manufacturers are carrying $1.6 trillion in unshipped work, and the pile has grown in twenty-four of the last twenty-five months. A growing share of it is waiting on material. The order book is not the problem. The supply chain feeding the floor is.
How much unshipped work are US manufacturers holding?
The U.S. Census Bureau reported on 26 August 2026 that unfilled orders for manufactured durable goods reached $1,599.9 billion in July. That is the twenty-fourth increase in twenty-five months, and it stands 8.8 percent above July 2025.
Demand held up in the same report. New orders rose 1.1 percent in July to $339.3 billion, a gain in four of the last five months. Shipments rose 1.0 percent to $334.7 billion.
Orders keep arriving faster than shops can clear them. That gap is what the backlog number measures.
Why are shipments flat while orders keep arriving?
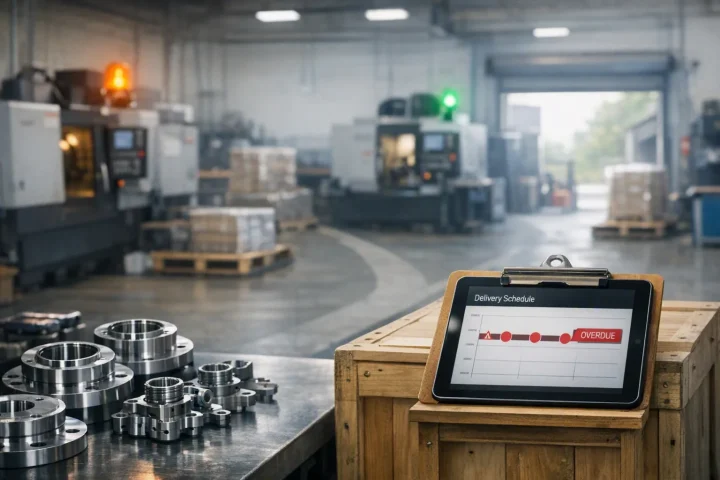
Fabricated metal shipments did not move in July. Census put them at $43.8 billion, a change of 0.0 percent from June. Unfilled orders in the same category rose 1.1 percent to $165.0 billion. That backlog is 6.9 percent above a year earlier. Work came in. Work did not go out.
Machinery ran the same way. Shipments rose 3.2 percent in July, yet backlog still climbed 0.6 percent to $152.2 billion. Even a category shipping hard is falling further behind.
Output is rising across metal-intensive categories. Backlog is rising faster.
What is causing the manufacturing material shortages?
S&P Global points at supplier delivery times. Its flash US Manufacturing PMI for August, released 21 August 2026, fell to 53.2 from 53.9. The output index dropped to 51.9, the slowest production growth in thirteen months. S&P Global tied that slowdown to raw material shortages linked to supply chain delays.
Supplier delivery times lengthened in August to one of the greatest extents recorded in four years. The survey blamed shipping delays, tariffs, and thin stock at suppliers.
A second driver is fading rather than building. Early in the conflict in the Middle East, shops built safety stock against price rises and supply shortages. S&P Global reported that this stockbuilding had been a key source of factory growth in those months. It now appears to be receding.
Is this a capacity problem or a supply problem?
Machine capacity is not the constraint. The Federal Reserve reported on 18 August 2026 that manufacturing output rose 0.2 percent in July. Output stood 1.2 percent above its year-earlier level. Capacity utilization for manufacturing reached 76.0 percent, which is 2.2 percentage points below its 1972 to 2025 average.
Labor is not the constraint either. The Philadelphia Fed employment index rose 18 points in August to 27.9, its highest since April 2022.
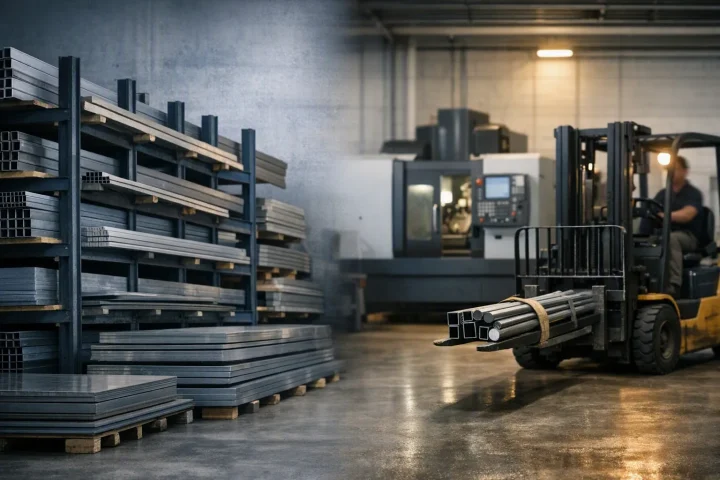
Shops have room on the floor and are adding hours and people. What they lack is the bar stock, the casting, or the purchased component a job needs. That shortage is what makes the choice between carrying safety stock and buying just in time a live one this year.
What does the picture look like in Pennsylvania?
The Federal Reserve Bank of Philadelphia found the same pattern in its own district. That district covers Delaware, southern New Jersey, and eastern and central Pennsylvania. Its August survey was published 20 August 2026, with responses collected from 10 to 17 August.
General activity came in at 47.4, the highest reading since April 2021. New orders fell 7 points to 30.1 and shipments fell from 33.7 to 27.7.
Two indexes tell the supply story directly. The delivery times index stayed positive at 3.7, so lead times in the district were still getting longer. At the same time, the inventories index turned negative at -3.7. Regional shops are busy, and their shelves are thinning.
Where is the material actually sitting?
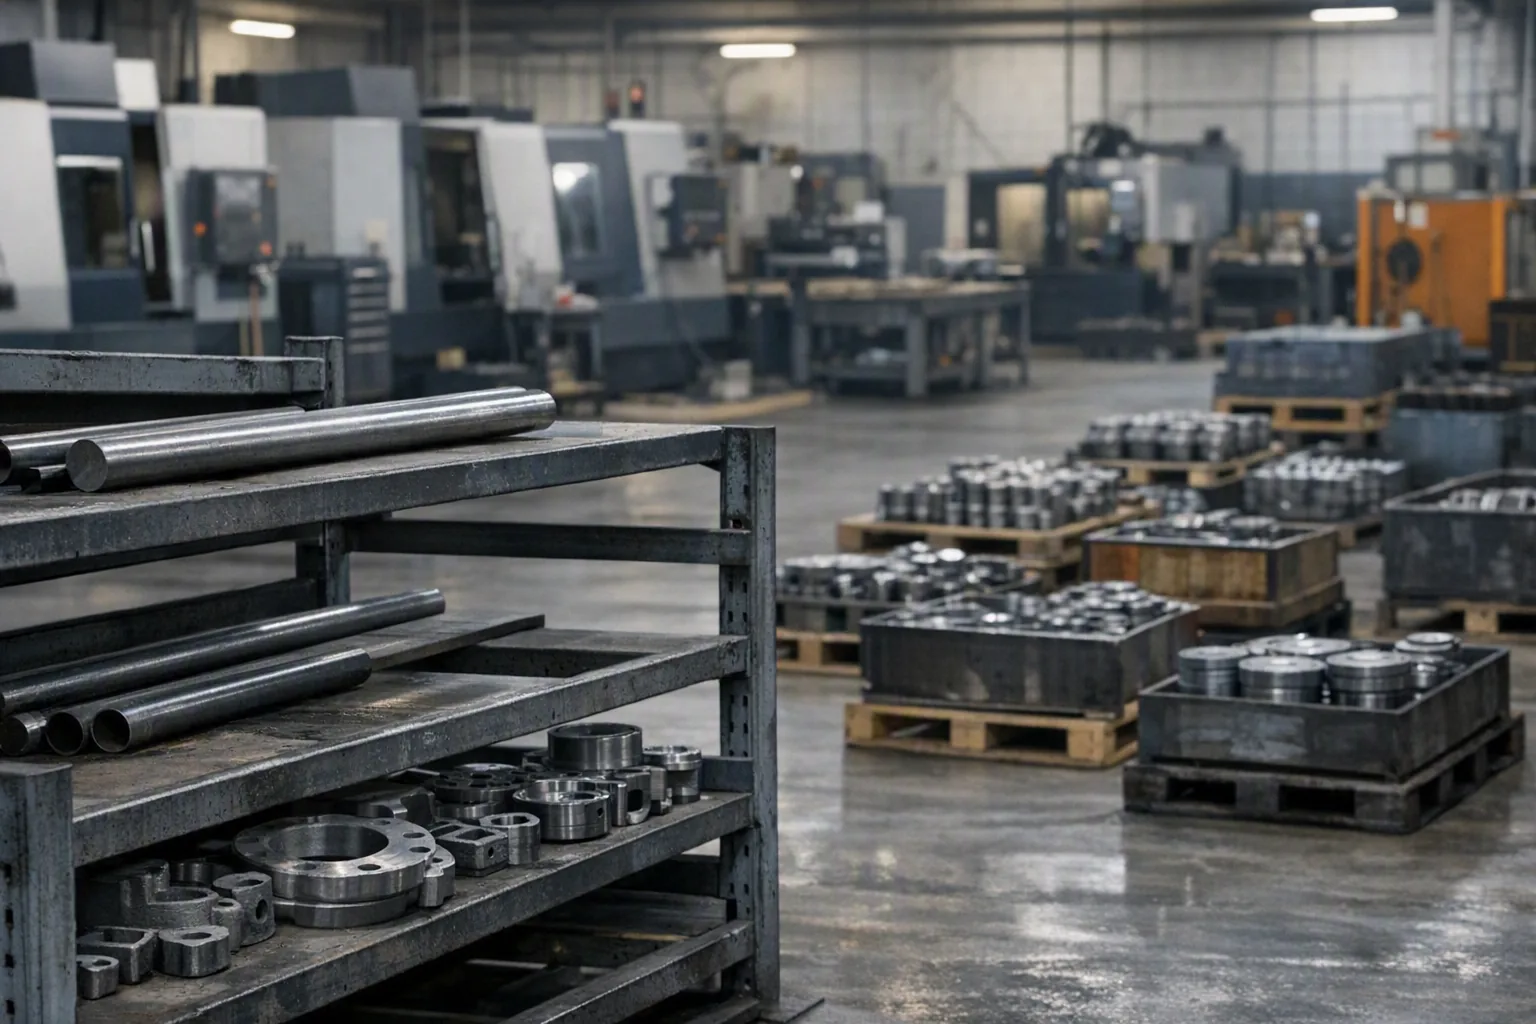
Material is accumulating, though not where a job shop can reach it. Census reported inventories of manufactured durable goods up for a tenth consecutive month to $604.4 billion. Primary metals inventories led that increase.
Those stocks have risen for seventeen consecutive months, climbing 1.5 percent in July to $51.9 billion.
Metal is in the system. Between the mill and the shop sit the shipping delays the two surveys describe.
Are input costs still climbing in 2026?
Cost pressure eased in August without disappearing. The Philadelphia Fed prices paid index fell 13 points to 40.9, its lowest reading since February. It stayed above its long-run nonrecession average. Not one responding firm reported a decrease in input prices.
S&P Global put input cost inflation at a four-month low that remained high. Energy prices and tariffs drove it. Manufacturers kept raising selling prices in response.
Buyers are watching. In the same survey, 37.5 percent of firms said core customers had grown more price sensitive since the prior quarter.
What do manufacturers expect for the rest of 2026?
Firms in the Third District expect the pressure to hold and are spending against it. The future capital expenditures index rose 18 points to 48.2, its highest in fifty-three years.
Some 43.5 percent of firms anticipate near-term cost changes. Of those, 80 percent expected competitors to raise prices, with a median expectation of four months.
What can a shop control when material runs late?
A shop cannot shorten a mill’s lead time. Two things are inside its control. It can decide how much material to carry against how much cash to tie up. It can also decide what a buyer finds after a promise date slips.
What a buyer does after that date slips is covered in how purchasing managers respond to supplier lead time misses.
The August data does not describe a downturn. It describes a sector holding $1.6 trillion in unshipped work and running 2.2 percentage points under its long-run capacity rate. The supply chain cannot keep the floor fed. For a shop owner, the question for the rest of 2026 is not whether the work is there. In the end, it is whether the material arrives in time to ship it.
This article is general industry information and is not financial, legal, or trade compliance advice. Conditions change. Confirm current figures with the cited source.
Frequently Asked Questions
What does a rising unfilled orders number mean for a machine shop?
Unfilled orders measure work a manufacturer has accepted and not yet shipped. Durable goods backlog hit $1,599.9 billion in July 2026, up 8.8 percent in a year. A rising backlog alongside flat shipments means the constraint sits in production or supply, not in demand.
Is US manufacturing in a recession in 2026?
The August 2026 data shows expansion, not contraction. The S&P Global US Manufacturing PMI read 53.2, above the 50 line that separates growth from decline, and the Philadelphia Fed general activity index reached a five-year high of 47.4. Growth slowed. It did not reverse.
How long are supplier lead times for raw material right now?
No major survey publishes an average lead time in days. The S&P Global and Philadelphia Fed indexes measure direction, not duration. Both showed lead times still lengthening in August 2026, with S&P Global recording one of the sharpest deteriorations in supplier delivery times in four years.
Are steel and aluminum tariffs still affecting material costs?
Tariffs remain one of the named cost drivers. S&P Global cited tariffs alongside energy prices as the main sources of high input cost inflation in its August 2026 flash PMI, and named tariffs among the causes of longer supplier delivery times and thinner stock at suppliers.
Should a shop quote fixed prices while material lead times are moving?
That is a risk decision, not a rule. A fixed price locks the quoted material cost and the quoted delivery date at the same time. When 80 percent of Philadelphia Fed respondents expect competitors to raise prices within a median of four months, a long quote validity window carries both risks.
When does the next round of manufacturing data come out?
The Institute for Supply Management releases the August Manufacturing PMI on 1 September 2026. Census publishes the full July report on manufacturers’ shipments, inventories and orders on 2 September, and the August advance report on 25 September. The Philadelphia Fed survey follows on 17 September.
About MFG Empire
MFG Empire is a marketing firm in York, Pennsylvania that works only with manufacturers. Rodney Hill founded it after more than 25 years on the shop floor. The firm writes for machine shops, fabricators, OEMs, and contract manufacturers rather than for a general business audience.
Two places that matter when lead times move:
- Manufacturing Website Design: Capability pages that state equipment, tolerances, materials, and certifications
- Manufacturing SEO: Research into the process terms purchasing managers use when sourcing
Not getting quote requests from your site?
Request a quote and we will tell you what a buyer sees on it today.
About the Author
Rodney Hill is the founder and president of MFG Empire, a marketing firm in York, Pennsylvania built for machine shops, OEMs, and industrial manufacturers. He spent more than 25 years working directly on the shop floor across CNC machining, tool and die, fabrication and welding, and industrial machine dealerships. He troubleshot CNC controls at BobCAD-CAM and built a customer base of over 2,500 users at Dolphin CAD-CAM before turning to marketing full time.
Today he works with manufacturers across North America and overseas, many of them supplying aerospace, space, powersports, and automotive programs. Fox Business has interviewed him on economic pressure facing small manufacturers. He also holds partnerships with ten of the largest MEP networks in the United States.
Reach Rodney at rodney@mfgempire.com or 717-650-0453.
Works Cited
Board of Governors of the Federal Reserve System. “Industrial Production and Capacity Utilization: G.17.” Board of Governors of the Federal Reserve System, 18 Aug. 2026, www.federalreserve.gov/releases/g17/current/default.htm.
Federal Reserve Bank of Philadelphia. “Manufacturing Business Outlook Survey: August 2026.” Federal Reserve Bank of Philadelphia, 20 Aug. 2026, www.philadelphiafed.org/surveys-and-data/regional-economic-analysis/manufacturing-business-outlook-survey.
Institute for Supply Management. “ISM PMI Reports.” Institute for Supply Management, accessed 31 Aug. 2026, www.ismworld.org/supply-management-news-and-reports/reports/ism-pmi-reports/.
S&P Global Market Intelligence. “S&P Global Flash US PMI: August 2026.” S&P Global, 21 Aug. 2026, www.pmi.spglobal.com.
United States Census Bureau. “Monthly Advance Report on Durable Goods Manufacturers’ Shipments, Inventories and Orders: July 2026.” United States Census Bureau, 26 Aug. 2026, www.census.gov/manufacturing/m3/adv/current/index.html.
Related Articles
Safety Stock or Just in Time: How Shops Are Buying Material Now
When Lead Times Slip, Buyers Start Looking for a Second Source